Heap Dump
A heap dump is a snapshot of the memory of a Java process. We can use heap dump for memory related issue. To make good use of heap dump, you should understand the design of the application that you trying to troubleshoot.
I suggest you to read the tutorials and resources in the bottom of this page.
jamp histo:live
This gives you a histogram of currently live object. In order to determine liveness, Java has to run full GC.
/app/jdk/jdk1.7.0_72/bin/sparcv9/jmap -histo:live 21961 > /tmp/prf2_Jmap_0323_IS_01.txt
CUP Comsume Thread
$prstat -L -p 22962
$prstat -L -p [PID]
This command will tell you which is thread comsuming more CPU, you need to take the first LWPID (493) and convert to HEX 0x1ed,
Then in Thread Dump, you search for 0x1ed. In below example, we found out writeLogEvent is taking most memory, so we need to lower the log level
$prstat -L -p 21401

PID USERNAME  SIZE   RSS STATE  PRI NICE      TIME  CPU PROCESS/LWPID
22962 weblogic   14G   13G cpu202   0    0   0:40:51 0.4% java/493
22962 weblogic   14G   13G sleep   59    0   0:06:33 0.2% java/40
22962 weblogic   14G   13G sleep   59    0   0:06:02 0.1% java/39
22962 weblogic   14G   13G sleep   59    0   0:06:00 0.1% java/38
In ThreadLogic, 493 is native-id(nid=0x1ed) and it is running writeLogEvent.
"/atg/dynamo/service/logging/LogQueue-0" daemon prio=3 tid=0x000000010993d230 nid=0x1ed runnable [0xfffffffbfbc5e000]
java.lang.Thread.State: RUNNABLE
        at java.io.FileOutputStream.writeBytes(Native Method)
        at java.io.FileOutputStream.write(FileOutputStream.java:345)
        at java.io.PrintStream.write(PrintStream.java:480)
- locked <0xfffffffcc3e300a8> (a java.io.PrintStream)
        at sun.nio.cs.StreamEncoder.writeBytes(StreamEncoder.java:221)
        at sun.nio.cs.StreamEncoder.implFlushBuffer(StreamEncoder.java:291)
        at sun.nio.cs.StreamEncoder.flushBuffer(StreamEncoder.java:104)
- locked <0xfffffffcc3e301e8> (a java.io.OutputStreamWriter)
        at java.io.OutputStreamWriter.flushBuffer(OutputStreamWriter.java:185)
        at java.io.PrintStream.write(PrintStream.java:527)
        - locked <0xfffffffcc3e300a8> (a java.io.PrintStream)
        at java.io.PrintStream.print(PrintStream.java:669)
        at com.company.common.service.logging.companyLogEvent.writeLogLinePrefix(companyLogEvent.java:79)
        at atg.nucleus.logging.DisplayLogger.writeLogEvent(DisplayLogger.java:309)
- locked <0xfffffffcc3628660> (a com.company.common.service.logging.companyCustomRotatingFileLogger)
        at atg.nucleus.logging.DisplayLogger.logEvent(DisplayLogger.java:241)
        at atg.nucleus.logging.DispatchLogger.logEvent(DispatchLogger.java:239)
        at atg.nucleus.logging.LogListenerQueue.dispatchElement(LogListenerQueue.java:167)
        at atg.service.queue.EventQueue.dispatchQueueElements(EventQueue.java:292)
        at atg.service.queue.EventQueue$Handler.run(EventQueue.java:92)
Java VM Options You Should Always Use in Production
-verbose:gc
-XX:+PrintGCDateStamps
-XX:+PrintGCDetails
-XX:+CMSParallelRemarkEnabled
-XX:+HeapDumpOnOutOfMemoryError
-XX:ParallelGCThreads=4
-XX:ParallelCMSThreads=2 //Parallel GC
-XX:CMSInitiatingOccupancyFraction=85 //GC at 85%
select * from "atg.nucleus.RequestScopeManager"
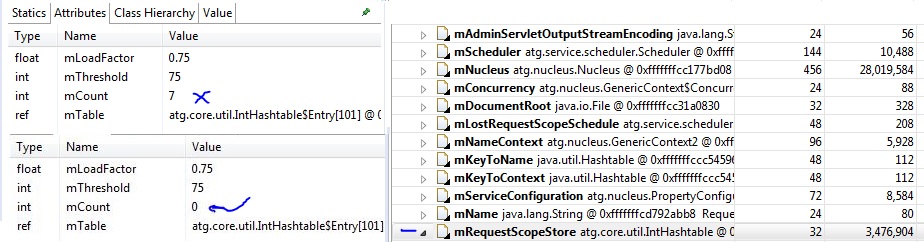
mRequestScopeStore->mTbale->Total: 7 entries (should have 1 HashTable only)
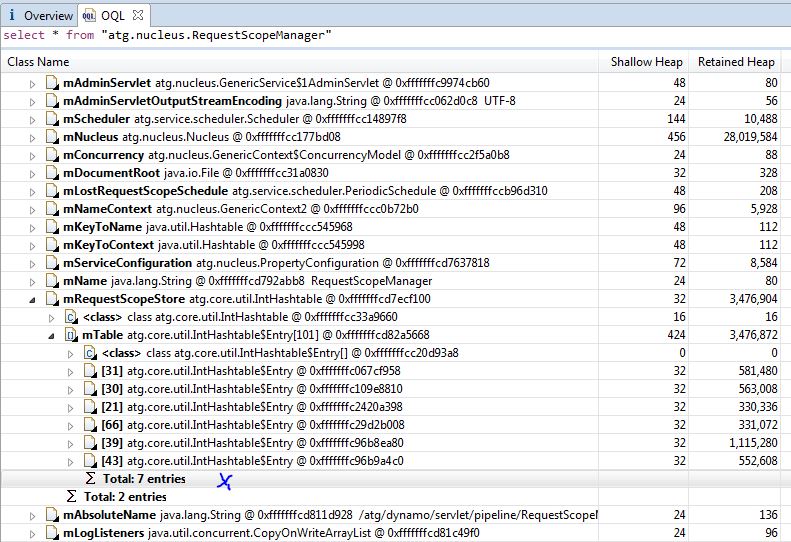

RequestScopeStore should be 0 since after each call, we should eliminate the object.
Tutorials and Resources